Dashboard
Dashboard
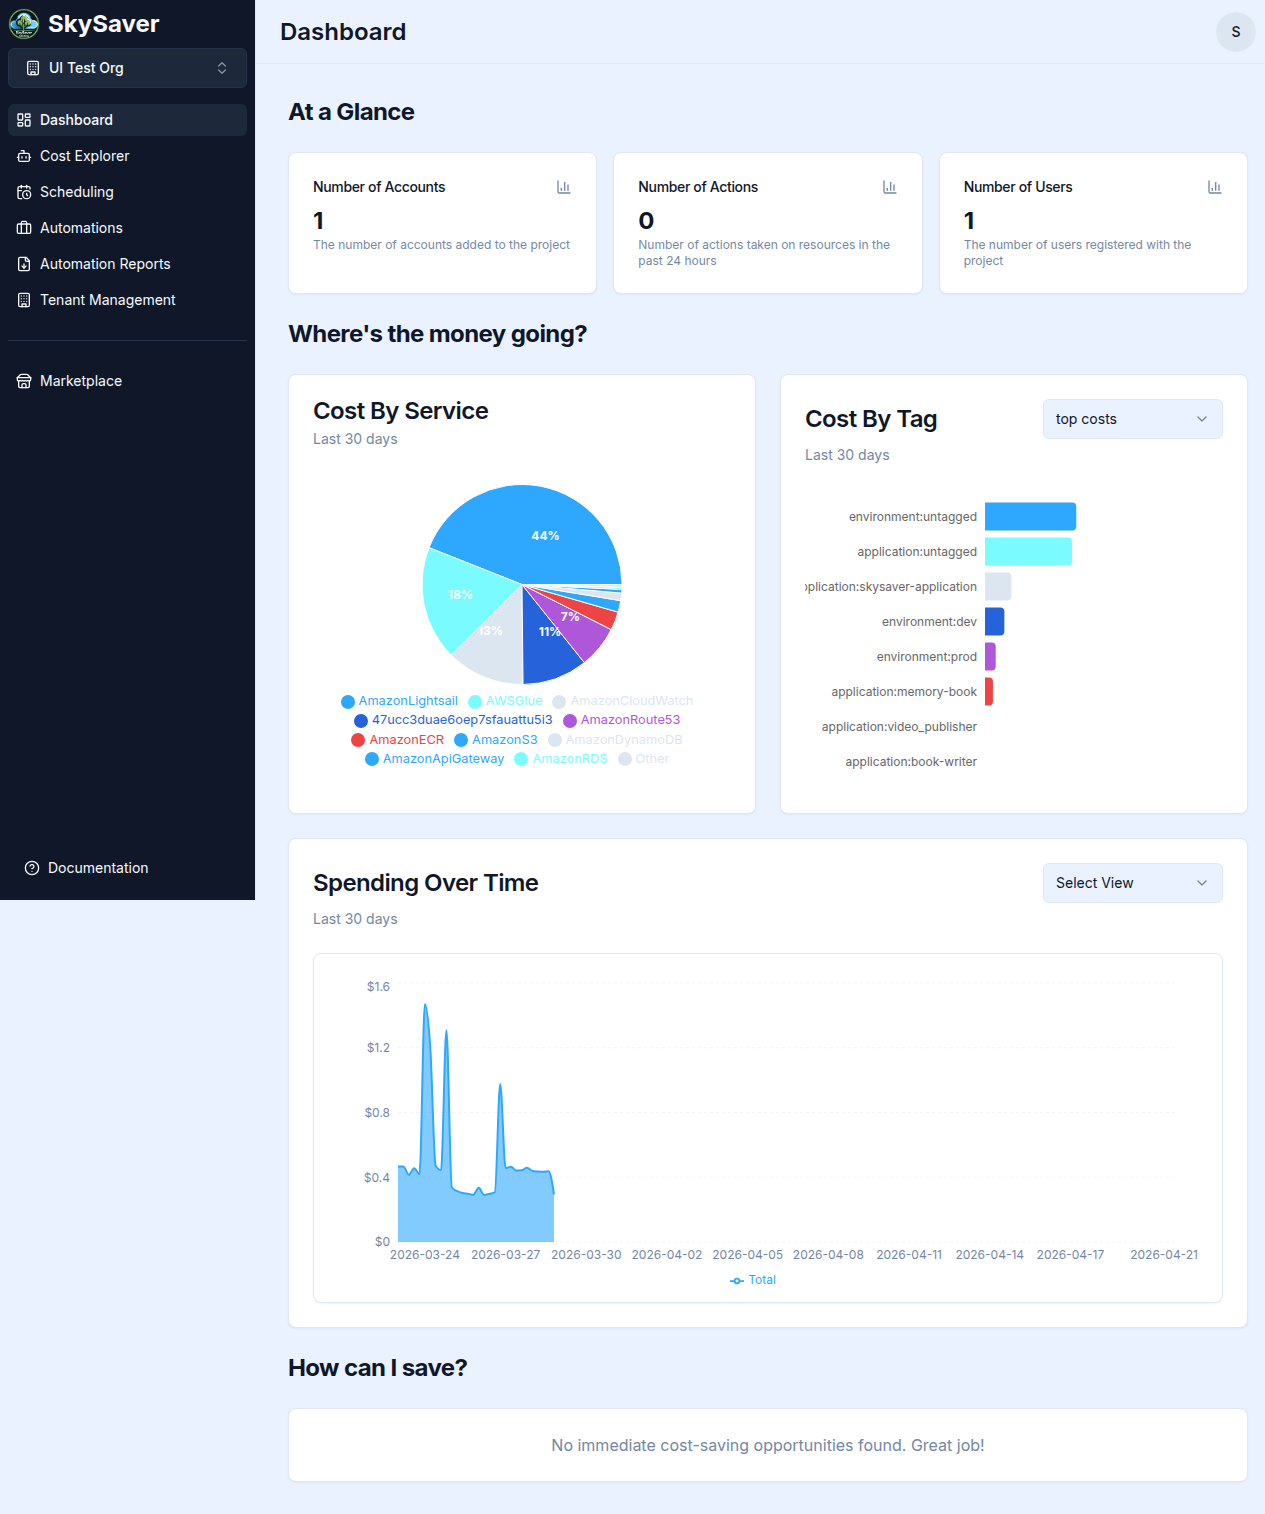
The SkySaver Dashboard is your central view for understanding your AWS costs, scheduling activity, and optimization opportunities. It is organized into three sections.
Note: The Where’s the money going? and How can I save? sections require the Cost Explorer automation to be enabled and data to have been collected.
At a Glance
Three metric tiles give you an immediate summary of your project activity:
| Tile | Description |
|---|---|
| Number of Users | Total users in your SkySaver project |
| Number of Actions | Total automation actions taken across all runs |
| Number of Accounts | AWS accounts connected to your project |
Where’s the money going?
This section breaks down your AWS spend three ways:
Cost By Service
A pie chart showing how your spend is distributed across AWS services (EC2, RDS, S3, Lambda, etc.) for the last 30 days. Hover over a segment to see the exact amount and percentage.
Cost By Tag
A bar chart showing spend broken down by the value of a selected cost allocation tag. Use the tag selector dropdown to switch between your configured tags (e.g., Environment, Team).
Tags must be configured in Project Defaults and activated in your AWS Billing Console before they appear here. See Cost Allocation Tags.
Spending Over Time
An area chart showing daily spend trends. This view helps identify spikes, gradual increases, or the impact of scheduling changes over time.
How can I save?
This section surfaces AI-driven cost optimization recommendations. Each recommendation card shows:
- Category and brief description of the opportunity
- Estimated monthly savings
- An action button to act on the recommendation (e.g., Stop Instances, Downsize, Setup Schedule, Apply Policy)
See Cost Optimization Recommendations for full details.
Dashboard Refresh
Dashboard data reflects what has been collected by SkySaver’s daily automations. Cost data has a 24–48 hour delay from AWS. The page does not auto-refresh; reload the browser to see updated counts.
Related Topics
- Cost Explorer — Advanced cost queries and filtering
- Cost Optimization Recommendations — Full recommendations workflow
- Automation Reports — Execution history for automations
- Key Concepts — Understanding SkySaver terminology